At a Glance
- The federal government launched the portal on Sept. 8.
- It shows real-time and historical data for climate hazards, including heat and wildfires.
- It also lets users look at future projections.
The federal government has a new website that lets Americans track the effects of climate change in real-time in their own communities.
________________________________________________________________________
Also read: World Meteorological Day celebrates the ocean, our climate and weather
________________________________________________________________________
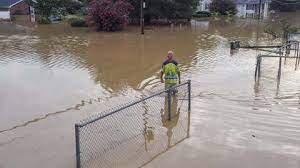
The portal includes maps and data that highlight climate change hazards in the United States, including heat, wildfires, drought and flooding.
On Wednesday afternoon, for example, it noted that more than 114 million people were experiencing extreme drought nationwide, 14.5 million people were under flood alerts and 350 active wildfires were burning.
Graphs show historical data that goes back up to a year, depending on the category. On Aug. 30, for example, 65 million people in the U.S. – or about 20% of the population – were under heat alerts as a week of record-high temperaturesstarted over much of the West.
And on Sept. 5, nearly 96 million people were under flood alerts as heavy rain hit several areas, including parts of the Northeast.
Users can dig even deeper into specific census tracts, counties or tribal lands with the map explorer tool.

(Source: Climate Mapping for Resilience and Adaptation )
________________________________________________________________________
Read Also: Nature Reclaims Its Glory, Ozone Layer Heals, Amidst Coronavirus Lockdown
________________________________________________________________________
In addition to historical data, there are future projections as well. Users can input any location and choose from three time periods with two different projected levels of greenhouse gas emissions, which fuel climate change by trapping heat in the atmosphere. The results will show the likelihood of each of the hazards under each scenario.
Each type of hazard tracked is one that scientists say is made worse by climate change.
(MORE: Are U.S. Cities Ready For Extreme Heat?)
The portal, formally called Climate Mapping for Resilience and Adaptation, is a joint effort from the White House, the National Oceanic and Atmospheric Administration and the Department of the Interior.
The hope is that it will guide state and local governments in infrastructure planning and efforts to mitigate the effects of climate change.
________________________________________________________________________
Read Also: How can we support sanitation workers during COVID-19?,
________________________________________________________________________
“Building climate resilience starts with communities, leaders, and other decision-makers understanding their specific climate threats,” NOAA Administrator Rick Spinrad said in a news release. “CMRA provides the public with the same NOAA-powered data that the federal government relies on every day to make sound decisions about climate preparedness.”
The Weather Company’s primary journalistic mission is to report on breaking weather news, the environment and the importance of science to our lives. This story does not necessarily represent the position of our parent company, IBM.
NOTE – This article was originally published in weather and can be viewed here
Tags: ##climates, #climate, #climatechange, #climatecrisis, #climateeffects, #environment, #flooding, #getgreengetgrowing, #gngagritech, #greenstories, #weather, #wildfires


