Abstract
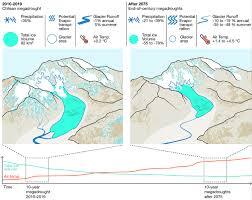
Glacier melt sustains water discharge from mountain basins during droughts, but ongoing glacier retreat threatens this fundamental capacity. Here, we assess the response of glaciers in the Southern Andes to one of the most severe, persistent, and extensive droughts on record in South America (2010-present), and to projected end-of-century megadroughts. Using glacio-hydrological numerical simulations, we show that despite a mean annual precipitation deficit of 36%, glacier runoff in 2010-2019 remained almost unaltered compared to the preceding decade (2000-2009), sustained by a 10% loss of total ice volume. However, simulations of future glacier evolution indicate that annual and summer glacier runoff could decline by up to 20 ± 11% and 48 ± 6%, respectively, during end-of-century megadroughts compared to pre-2010 levels. Our results project a weakening of the glacier’s buffering role against precipitation deficits during extreme droughts, increasing water scarcity for ecosystems and livelihoods in the mountain regions of South America.

Introduction
Meteorological droughts can lead to water-stressed ecosystems1,2 and produce dramatic impacts for human societies, including reduced public water supply, crop failures and energy shortages3,4,5. The term megadrought has been used to describe persistent multi-year precipitation deficits that result in severe hydrological, ecological, agricultural or socioeconomic droughts6,7. Over the past two decades, severe droughts in California8, Europe9, and China10 have caused large economic losses and damage to ecosystems. Because climate models project an increase in both the frequency and intensity of droughts11,12, serious concerns have emerged about the effect of future droughts and their impacts on societies11,13. A notorious drought of recent decades has been the Chilean megadrought14, which has affected the central regions of Chile and western Argentina since 2010 (Fig. 1a,b) causing severe hydrological and societal impacts. With a population over twenty million people and a strong dependence on meltwater from the Andes Cordillera15, central Chile and western Argentina have based a large part of their economies on industries that are greatly affected by water scarcity, such as agriculture and mining16,17,18. The Chilean megadrought stands out in the instrumental19 and paleoclimatic record in South America20,21 due to its persistence (from 2010 to present), severity and large spatial extent, spanning from approximately 30 to 40°S and from coastal Chile to the eastern slopes of the Andes (Fig. 1a, b and Supplementary Fig. 1). Annual precipitation deficits during the megadrought have ranged between 25% and 45%14,19. The Chilean megadrought ranks in the top twenty worldwide in the period 1987–2016 in terms of duration and severity22,23. The major causes of the Chilean megadrought lie in a persistent large-scale circulation pattern that blocks the passage of extratropical storms over central Chile (Supplementary Note 1). This configuration has been likely driven by a negative phase of the Pacific Decadal Oscillation (PDO) (associated to natural variability) and a positive phase of the Southern Annular Mode (SAM) (associated with anthropogenic forcing)19,24. The Chilean megadrought has had cascading effects on streamflow25, lake levels26, soil moisture27, wildfires28, sediment export29, and glacier mass balance30. The combination of these effects can be particularly critical in arid and semi-arid mountain regions where water shortages can trigger social conflicts31,32.

a Location of the study domain in South America. b Location of the 100 largest glaciers in the RGIv6.0 between 30°S and 40°S, along with relative precipitation changes in the CMD. White colour over Argentina represents areas where the CR2Met precipitation product is not available (“no data”). c Mean monthly precipitation totals and mean air temperature for the selected glaciers (downscaled and bias-corrected forcing data for TOPKAPI-ETH). “2019” stands for the extremely dry year of 2019. d Histograms of annual mean glacier mass balance (TOPKAPI-ETH outputs), the distributions were tested to be different at a 5% significance level. Dashed vertical lines show the mean of each distribution (e) Monthly glacier runoff (lines) and ice melt (shaded areas) total volume for REF, CMD and 2019 (TOPKAPI-ETH outputs).
_______________________________________________________________________
Read Also : Satellite images reveal the fastest Antarctic glacier retreat ever
________________________________________________________________________
The impact of the Chilean megadrought on the cryosphere of the Southern Andes provides a unique opportunity to understand the role of glaciers in buffering sustained precipitation deficits. The Southern Andes extends from 20 to 55°S and contains more than 15,000 glaciers33. While seasonal snowmelt is the main source of runoff for areas adjacent to the Andes34,35, glacier meltwater compensates for the lack of other freshwater sources during dry periods. For example, in recent decades, glacier runoff has contributed approximately 15% to the annual discharge of rivers in Central Chile (e.g. the upper Maipo and Aconcagua catchments), with contributions exceeding 50% during summer, depending on the elevation of the river outlet30,36,37. Around the world, glacier meltwater has been able to compensate for precipitation deficits during droughts32,38, but this buffering capacity is threatened by glacier retreat39,40. Although accelerated glacier melt in glacierised basins can lead to a transient increase in annual runoff (known as “peak water”41), meltwater discharge is expected to decrease if glacier retreat persists42. This has been observed in the Southern Andes across central Chile and Argentina, where runoff from glaciers has decreased compared to 20th century reconstructions37 due to glacier mass loss38,43,44. Previous work suggests that the glaciers of the Southern Andes have played a key role in sustaining water systems during the ongoing megadrought, but their capacity to buffer precipitation deficits during future droughts will be threatened by their expected continued retreat in the 21st century41. The relatively low level of large-scale human intervention in the Southern Andes (compared to, for example, the European Alps) enables the analysis of a natural system and provides an opportunity to analyse the impacts of future multi-year droughts on mountain water resources.
Here, we examine the hydrological response of glaciers during a 10-year sub-period of the Chilean megadrought (2010-2019) and during megadroughts projected to occur by the end of the century under global climate projections. We use the TOPKAPI-ETH glacio-hydrological model37,45 to simulate the evolution, mass balance and runoff of the 100 largest glaciers in the Southern Andes between 30°S and 40°S, which is the latitudinal range most affected by the Chilean megadrought. The selected 100 glaciers comprise a total of 82 km3 of ice volume, representing 65.8% of the total glacier volume in the region (Supplementary Fig. 1). Their outlines are extracted from the Randolph Glacier Inventory v6.0 (RGIv6.0)33. TOPKAPI-ETH is a spatially distributed physics-based model that explicitly parameterises the main processes governing glacierized environments, including mass redistribution due to ice flow, avalanching and ice melt under debris (Methods). The model considers snow albedo decay and distributed ice albedo, which are key elements to understand the impact of snowfall reduction on surface melt46,47, as well as geometry changes due to glacier dynamics48, which are essential in century-scale simulations49. We run the model at high horizontal (100 m) and temporal (3-hour) resolutions. We calibrate and evaluate the model parameters for each selected glacier using a global geodetic glacier mass balance dataset44 and satellite-derived albedo retrievals from MODIS50 (Supplementary Figs. 2–7). Simulations are forced with meteorological gridded data for hydrological years (1 April to 31 March) during the period 2000–2019 extracted from CR2Met v2.051 and ERA5 reanalysis52. The model is then used to generate projections for the period 2000–2099 using outputs from four Global Climate Models (GCM) and two Representative Concentration Pathways (RCP) taken from the fifth phase of the Climate Model Intercomparison Project (CMIP5)53: a moderate (RCP2.6) and a high (RCP8.5) future greenhouse gas (GHG) emission scenario. We downscale and bias-correct the coarse-resolution outputs of the GCMs to adjust the spatial mismatches and systematic biases when compared to the glacier scale54,55 (Supplementary Figs. 8–9). We use 2000–2009 as a reference period for subsequent comparisons of glacier runoff and other variables, since it has been identified as a period of near-neutral glacier mass balance in the study area56,57. End-of-century megadroughts are assumed to correspond to the 10-year period with the lowest precipitation that occurs during 2075–2100 for each combination of GCM and RCP (Methods and Supplementary Fig. 10). Based on previous studies, we define glacier runoff as the sum of meltwater from glacier ice and seasonal snow plus liquid precipitation within the glacier area at the start of the simulations (i.e. year 2000)41. TOPKAPI-ETH explicitly differentiates these runoff components, which are used to analyse internal shifts in the glacier hydrology. Changes in glacier runoff are evaluated on an annual and summer (JFM) basis.
Results
Glacier response to the Chilean megadrought
The Chilean megadrought has been defined by a strong and persistent reduction in precipitation across Chile and western Argentina compared to the preceding 30 years (Supplementary Fig. 11). Hereafter, we refer to changes compared to annual averages in the 2000–2009 reference period, unless otherwise stated. Glacier area and volume changes are computed with respect to the initial values of the simulations (year 2000). Precipitation reductions in 2010–2019 ranged from less than 15% in areas south of 37°S to more than 30% between 31°S and 37°S, where most of the glaciers are located (Fig. 1b and Table 1). Precipitation over the selected glaciers changed by −36 ± 12% (average and standard deviation from the sample of glaciers), with most of this decrease concentrated in the austral winter (JJA), when the bulk of precipitation occurs (Fig. 1c, left axis). Compared to precipitation, changes in air temperature were less pronounced, with a warming of 0.2 ± 0.1 °C (Fig. 1c, right axis). TOPKAPI-ETH results show that the frequency distribution of glacier mass balance became increasingly skewed towards negative values during the megadrought, with the average glacier mass balance becoming four times more negative ( − 0.8 ± 0.5 m w.e. a−1 compared to −0.2 ± 0.3 m w.e. a−1 in the 2000–2009 period, Fig. 1d), leading to a 10% loss of the total ice volume existing at the start of the megadrought. Total glacier runoff volume from the 100 selected glaciers decreased only slightly during the megadrought (decrease of 1%), with most glaciers (95%) experiencing glacier runoff changes between −20 and +20% (Supplementary Fig. 12). Ice melt, however, increased by 118% during the megadrought, offsetting the decrease in snowmelt (32%) associated with precipitation decline (Fig. 1c and Table 1). We estimate that the selected glaciers provided an additional ice melt contribution of 454 ∙ 106 m3 a−1 during the megadrought, which is equivalent to twice the capacity of El Yeso, the largest reservoir for the drinking water supply of Santiago, Chile58. The changes observed during the megadrought were amplified in the extremely dry and warm year of 2019 (Fig. 1c–e), one of the driest years on record59 and the warmest year within the megadrought period in our study domain. Precipitation in 2019 was 66 ± 23% lower than in the reference period (Fig. 1c), while air temperature increased by 0.9 ± 0.2 °C (Fig. 1c) and the average glacier mass balance was −1.8 ± 1.0 m w.e. a−1 (Fig. 1d). Glacier runoff and ice melt were 25% and 390% higher, respectively, compared to the reference period (Fig. 1e).
Climate projections and future glacier evolution
Climate projections indicate an increase in air temperature, leading to a massive loss of glacier volume. Air temperature anomalies over the selected glaciers are similar for both RCPs in 2000–2020 (Fig. 2a), after which they begin to diverge considerably, with strong differences emerging from 2040 onwards. By the end of the century, mean annual temperatures in the 2090–2099 decade are projected to increase by 1.5 ± 0.3 °C (average and standard deviation over GCMs) under RCP2.6 and 4.7 ± 0.4 °C, under RCP8.5. Differences in projected annual precipitation changes between the scenarios are less pronounced (Fig. 2b). Annual precipitation under the RCP8.5 scenario decreases from 2050 onwards, reaching a − 38 ± 11% change as a decadal average in 2090–2099. In line with previous studies60, a slight decrease in precipitation is projected under the RCP2.6 scenario during the period 2030-2050, followed by a moderate increase by the end of the century. Precipitation deficits during the Chilean megadrought are outside the standard deviation of the selected scenarios for 2000-2019, demonstrating the severity of this event. We note that the reference period (2000-2009) was more humid than the full period used for bias-correcting the GCMs (1990-2019), and both RCP scenarios show negative precipitation anomalies during the reference period (Methods). The projected warming also yields changes in the phase of precipitation over glaciers, with the annual ratio of liquid to total precipitation increasing from 6% to 16 ± 3% (30 ± 3%) under RCP2.6 (RCP8.5) in 2090–2099 (Supplementary Fig. 13).

a anomaly of annual mean air temperature, b anomaly of annual total precipitation, c changes in total glacier volume, d cumulative glacier mass balance, e anomaly of total glacier runoff, and f anomaly of summer glacier runoff. Anomalies of air temperature, precipitation and glacier runoff are relative to the reference period (2000–2009, REF). Changes in glacier and mass balance are relative to their initial values (year 2000). The continuous lines and the shaded areas in red and blue represent the averages and the ranges provided by the sample of GCMs under each scenario, respectively. Black lines represent the model results for the reference (REF) and the Chilean megadrought (CMD) periods (2000–2019). The grey shaded areas indicate the Chilean megadrought (2010-2019) and the future period in which we search for 10-year megadroughts (see next section). In Supplementary Fig. 16 we present the same changes presented here using absolute values. A summary of the average values for the 2090-2099 decade is presented in Supplementary Table 1.
The projected warming will have a large impact on glacier volume and mass balance (Fig. 2c-d). Results indicate future reductions in glacier volume of 55 ± 6% (RCP2.6) and 78 ± 4% (RCP8.5) and cumulative glacier mass balances of −42 ± 4 m w.e. (RCP2.6) and −58 ± 3 m w.e. (RCP8.5) by the end of the century. We do not project the disappearance of any selected glacier under the RCP2.6 scenario, but we estimate that 15 to 44 of the glaciers included in this study will disappear (i.e., will have more than 99% of volume loss) under the RCP8.5 scenario. Debris-covered glaciers and glaciers north of 34°S will retain more volume than debris-free glaciers and glaciers to the south, respectively (Supplementary Figs. 14–15). The RCP8.5 scenario indicates an annual glacier runoff 11% higher than the reference period for the decade 2036–2046 (i.e. a peak water phase for glacier runoff), followed by a steady decrease until 2100 (Fig. 2e). The RCP2.6 scenario also indicates a phase of peak water for glacier runoff between 2021 and 2031 (6% increase higher than the reference period), followed by a decline and a partial recovery in 2080–2100. This is likely driven by the moderate precipitation increase prescribed under this scenario (Fig. 2b). As a decadal average in 2090–2099, annual glacier runoff changes will be −7 ± 2% and −20 ± 11% under the RCP2.6 and RCP8.5 scenarios, respectively. The decrease of glacier runoff is projected to be more pronounced during summer, with changes of −41 ± 3% (RCP2.6) and −63 ± 7% (RCP8.5) in 2090-2099. This is consistent with results from a previous study that included catchments of the Southern Andes in global analyses41.
The role of glaciers during future megadroughts
Here we compare the glacier response to megadroughts projected for the end of the century against the observed glacier response during the Chilean megadrought (sub-period 2010-2019), using the reference period (2000–2009) as a base line (Fig. 3 and Table 1). Given the projected glacier mass loss, glaciers will not be able to compensate the decline in precipitation during future megadroughts in the same way as they have done during the current megadrought. End-of-century megadroughts show mean annual precipitation deficits of 21 ± 1% (average and standard deviation over GCMs) under RCP2.6 and 39 ± 10% under RCP 8.5 (Fig. 3a). These changes are similar in magnitude to that of the Chilean megadrought (36% deficit). Moreover, the changes are similar or larger than the precipitation reductions calculated by Chen et al.61 for the ten most severe megadroughts globally since 1980, which are in general above a 20% deficit. In contrast to the almost unchanged glacier runoff during the Chilean megadrought ( − 1% variation), glacier runoff significantly diminishes by 10 ± 4% (20 ± 11%) for the RCP2.6 (RCP8.5) scenario (significance at a 5% level). Ice melt decreases by 4 ± 14% under RCP2.6 and it increases by 37 ± 11% under RCP8.5, which is far from the 118% increase estimated for the Chilean megadrought, when more ice volume was available for melting (Table 1). The results show that the driest year of the Chilean megadrought (2019) was drier (precipitation deficit of 66%) than 60% of the driest years of each end-of-century megadrought (estimated deficits are 53 ± 7% and 61 ± 11% for the selected scenarios, Fig. 3a and Supplementary Fig. 10). However, glacier runoff during these projected driest years is much lower than that in 2019. In fact, while glacier runoff increased by 25% during 2019, buffering the dramatic water scarcity, it is projected to decrease by 27 ± 4% and 35 ± 11% during the future megadroughts under the RCP2.6 and RCP 8.5 scenarios, respectively. This indicates that, by the end of the century, glaciers will have exhausted their water provision capacity. Summer glacier runoff is also projected to be lower during future megadroughts than during the Chilean megadrought, varying between −35 ± 3% for RCP2.6 and −48 ± 6% for RCP8.5. This suggests very strong glacier runoff deficits during the warmest season. In contrast to the Chilean megadrought, which shows a relatively low temperature anomaly, end-of-century megadroughts are projected to occur under higher temperatures ( + 1.4 ± 0.2 °C and +4.5 ± 0.4 °C), which can also increase melt rates depending on the availability of snow and ice. In absolute terms, the projected decrease in glacier runoff varies between 208 and 419 million m3 a−1, depending on the emission scenario (1-2 times the capacity of El Yeso Reservoir). We expect that glacierised catchments will become less resilient to droughts, increasing their dependence on annual precipitation for runoff. This trend is evident in the values under global climate projections, as they move closer to the 1:1 precipitation-runoff line (Fig. 3). We present our main findings in a graph that summarizes the observed and projected changes in precipitation, air temperature, glacier volume and glacier runoff during the Chilean megadrought and the end-of-century projected megadroughts (Fig. 4).

Percent changes in total glacier runoff (y-axis) and annual precipitation (x-axis) during the Chilean megadrought (CMD) and its driest year (2019), as well as for the projected megadroughts and their driest years. Megadroughts and their driest year are represented by circles and diamonds, respectively. Changes in total glacier runoff refer to (a) annual and (b) summer (JFM) values, respectively. The circles represent the average between GCMs and error bars represent their total range. The colour of each marker indicates the air temperature anomaly averaged over GCMs for each corresponding period. All changes are compared to the 2000–2009 period.

Summary of changes in precipitation, air temperature, glacier volume and glacier runoff during the Chilean megadrought and the projected 10-year duration end-of-century (after 2075) megadroughts under RCP scenarios 2.6 and 8.5. Changes in precipitation, air temperature and glacier runoff are relative to the reference period (2000-2009, REF). Changes in total ice volume are relative to their initial values (year 2000). Given the projected increases in air temperature, we also anticipate an increase of potential evapotranspiration in downstream areas.
Discussion
We assessed the hydrological response of the 100 largest glaciers in the Southern Andes between 30 and 40°S during the Chilean megadrought, globally one of the most severe, intense, persistent and extensive droughts in recent decades. Additionally, we simulated the future evolution of the selected glaciers and their role during future megadroughts projected to occur by the end of the 21st century, using climate projections under RCP2.5 and RCP8.5 scenarios. The Chilean megadrought caused a mean annual precipitation deficit of 36 ± 12% across glaciers, but total glacier runoff remained virtually unchanged (decrease of 1%) due to a 10% loss in total glacier volume that resulted in a 118% increase in total ice melt. Our results unravel the relative contributions of snowmelt, ice melt and rainfall to runoff in glacierized basins during the megadrought, expanding on previous studies that estimated total glacier runoff based on glacier imbalance or total runoff (See Supplementary Table 2 for a detailed comparison30,38,42,62). In terms of mechanisms, our simulations show that the observed glacier imbalance during the Chilean megadrought was largely driven by the precipitation deficit and less by the slight increase of air temperature compared to the reference period (Fig. 1c). This can be explained by the high sensitivity that glaciers in the semi-arid Andes have towards precipitation deficits and albedo decrease, in turn due to the strong solar radiation that characterizes the area63,64. As shown by our simulations (Supplementary Figs. 17 and 18) precipitation deficits led to a strong decrease in glacier albedo and thus to largely enhanced glacier melt. The high sensitivity of the study glaciers towards albedo changes highlights the importance of explicitly accounting, at high spatial and temporal resolutions, for the decay in surface albedo due to snow aging, as well as the differences between snow and bare-ice albedo, when modelling glacier evolution, particularly in regions with a strong solar irradiance and interannual variability of precipitation. A combined effect of low precipitation and high air temperature occurred during 2019, which was the driest and warmest year in our study period. This resulted in a highly negative glacier mass balance ( − 1.8 ± 1.0 m w.e. a−1), notably more negative than the megadrought average ( − 0.8 ± 0.5 m w.e. a−1).
Our results project a decline in the water discharge from glacierized basins during future megadroughts in the Southern Andes, indicating that glaciers in this region will no longer be able to mitigate the impact of future droughts to the same extent as they did during the current megadrought. Although future projections of precipitation and runoff are subject to considerable uncertainty and may lie within the range of natural variability, it has been suggested that the substantial reduction in ice volume driven by projected temperature increases allows for a more confident estimation of declining water discharge in mountain catchments65. Indeed, our results show that in contrast to the relatively small changes in glacier runoff observed during 2010–2019, glacier runoff is projected to decrease substantially during end-of-century megadroughts compared to the reference period (2000–2009): by 10 ± 4% under RCP2.6 and by 20 ± 11% under RCP8.5 on an annual basis, and by 35 ± 3% and 48 ± 6% during summer. Crucially, these future megadroughts will occur under substantially warmer conditions than the current megadrought, accelerating melt rates and increasing potential evapotranspiration of downstream areas. We estimate that the projected increase in air temperature over glaciers in the Southern Andes will result in massive glacier volume loss with estimated changes of −55 ± 6% (RCP2.6) and −78 ± 4% (RCP8.5) relative to year 2000. The loss of glacier ice during future megadroughts will further impact glacier runoff by the last decade of the century, with even greater decreases expected depending on the climate scenario. We project that summer glacier runoff will decrease by 41 ± 3% (RCP2.6) and 63 ± 7% (RCP8.5) during the 2090-2099 decade. This reduction in runoff compensation by glaciers derives from the strong glacial retreat projected for the 21st century. Although our study includes several key processes driving glacier mass balance and runoff, our projections should be interpreted considering key limitations that remain in our modelling approach, such as the static representation of debris cover and uncertainties in future climate forcings and glacier dynamics (see Supplementary Note 2 for more details).
Our findings provide a quantification of glaciers role in buffering megadroughts over the evolving trajectories of glacier decline and increased temperature of the 21st century. They demonstrate the complexity and non-linear dynamics of the cryosphere response, and show how, at the end of the century, future megadroughts could impact mountain systems that have lost their capacity to compensate for precipitation deficits. This new understanding and the framework developed here will enable the anticipation of future water scarcity scenarios, especially in mountain regions facing glacier retreat and increased drought frequency and severity.
Methods
Glacier data
We extract the glacier outlines of the 100 largest glaciers in the Southern Andes between 30°S and 40°S (Fig. 1a) from the Randolph Glacier Inventory version 6.0 (RGIv6.0)33. We find that five large glacier polygons in the RGIv6.0 could be divided into two or more individual glaciers, according to a more detailed national inventory from Chile66, resulting in a total of 113 glacier polygons that are here treated as independent modelling units (Fig. 1b). We obtain surface topography from the Shuttle Radar Topography Mission (SRTM)67 digital elevation model (DEM), distributed ice thickness for the year 2000 from Farinotti et al.68, and distributed supraglacial debris thickness from Rounce et al.69. These datasets are bilinearly resampled to a 100 × 100 m regular grid. The selected glaciers comprise a total of 82.0 km3 of ice volume distributed over 1044 km2, representing 65.8% and 49.2% of the total glacier volume and area of the Southern Andes between 30 and 40°S, respectively. 320 km2 of this area (i.e. 31% of the total) is covered by debris. The elevation of the selected glaciers ranges between 1580 and 6709 m a.s.l., with a decreasing trend towards south (Supplementary Fig. 1a). Most of the glacier areas range between 1 and 40 km2, but the Tupungato Sur/Tunuyan Glacier reaches up to 69.3 km2 (Supplementary Fig. 1b). Although Universidad Glacier is the largest glacier of the study region in the RGIv6.0 (111 km2), this is one of the glaciers that we divided into several modelling units. Debris coverage varies from 0 to 90% of the total glacier area (Supplementary Fig. 1c). The decision of focusing on only the 100 largest glaciers was partly made due to the computational restraints of running a 100 m resolution hydrological model at a 3-hour timestep. The remaining glaciers in our study region are smaller than 1.1 km2. In line with the findings of Huss and Fischer70, we believe that their integrated response to projected changes is likely to be a mixed one, modulated by a rapid, sensitive response of steep mountain glaciers with a large elevation range (i.e. Tapado Glacier, Robson et al.71) and a slow, insensitive response of high-elevation glacierets and low-elevation glaciers covered by a thick debris layer.
We use glacier surface elevation changes from Hugonnet et al.44 and surface albedo from Moderate Resolution Imaging Spectroradiometer (MODIS)50 products as reference (i.e., observational) datasets to calibrate and evaluate TOPKAPI-ETH for the period 2000–2019 (see next sections). Glacier surface elevation changes are converted to mass changes using a glacier density of 850 kg m-372. Spatially distributed surface albedo is calculated at a 500 m horizontal resolution for the period 2000–2018 from the average of MOD10A1 (Terra) and MYD10A1 (Aqua) snow products provided by MODIS. Daily and monthly time series of glacier-wide surface albedo are calculated for each glacier using only the 500 m grid cells completely contained within the glacier boundaries. Grid cells without satellite information are filled with data from their neighbours or from other time steps, based on the methodology described by Gafurov and Bárdossy73. From the daily time series, we identify the date with the minimum glacier-wide albedo and extract the corresponding albedo map to be used as a base albedo map in TOPKAPI-ETH when the seasonal snow cover disappears.
Meteorological data
Glacier model simulations are forced using precipitation, air temperature and cloud cover transmissivity of solar radiation at a 3-hour time step. The first two variables are derived from the CR2Met v2.0 gridded meteorological product (CR2Met v2.0)51, which contains daily maps of precipitation and air temperature extremes at 0.05° × 0.05° resolution over the period 1979-2020. The CR2Met v2.0 products were generated by the Centre for Climate and Resilience Research (CR2) for Chile and the eastern slope of the Andes Cordillera. The CR2Met v2.0 daily total precipitation product was generated through a statistical post-processing approach, based on regression models between in-situ quality-controlled daily precipitation and moisture fluxes from the ERA5 reanalysis52, as well as topographic descriptors as predictors74. CR2Met v2.0 also includes maps of daily extreme air temperatures that were obtained using near-surface temperature from ERA5 and land surface temperature (LST) from the Moderate Resolution Imaging Spectroradiometer (MODIS), by means of multiple linear regression models using local observations as predictands, and LST as one of the explanatory variables. We average CR2Met maps of daily extremes to obtain daily mean air temperature maps.
We disaggregate the maps of daily precipitation amounts and daily mean air temperature to a 3-hour time step following the sub-daily distribution of the same variables from ERA5 (interpolated to the CR2Met grid). For each glacier, we calculate 3-hour air temperature lapse rates by fitting a linear regression model between the temperature and the elevation of the eight CR2Met grid cells that surround the cell corresponding to the glacier centroid. Using the daily average of the 3 h lapse rates, we transfer the 3-hour air temperatures from the linearly interpolated CR2Met grid to the centroid of each glacier adjusting by the elevation difference. Daily average air temperature lapse rates are also used in TOPKAPI-ETH to distribute air temperature over the elevation profile of each glacier (see next section). Time series of cloud cover transmissivity are derived directly from the ERA5 atmospheric reanalysis as the fraction between the total sky direct solar radiation at the surface and the clear sky direct solar radiation at the surface variables. Precipitation and cloud cover transmissivity are linearly interpolated to the centroid of each glacier without further correction.
For climate and hydrological future projections, we use outputs from four CMIP5 GCMs (CCSM4, CSIRO-MK3-6-0, IPSL-CM5A-LR and MIROC-ESMI), which are selected based on two attributes: (1) their ability to represent observed climate patterns in continental Chile at regional and large-scale level, and (2) the spread these models provide for projected changes in annual precipitation and temperature, which is similar in magnitude to that obtained using the full CMIP5 multi-model ensemble74. Given the high temporal and horizontal resolution of our glacier simulations (see next section), we decided not to include further GCMs. The selected emission scenarios are representative of moderate (RCP2.6) and high (RCP8.5) Greenhouse gas (GHG) emissions75. We use 1990/04/01–2020/03/31 (i.e., 30 water years) as the reference period for downscaling. The steps of downscaling and bias correction are essential to move from the coarse resolution outputs of the GCMs to the fine scale of the glacio-hydrological simulations. The horizontal resolution of the GCMs is between 1° and 4° and their time step is daily (see details in Supplementary Table 3). The downscaling procedure consists of a bilinear interpolation to the glacier centroid and a bias correction method performed following the Multivariate Bias Correction for n-dimensions (MBCn) approach proposed by Cannon54 and recommended for snowmelt-driven high-elevation catchments55. This downscaling method explicitly considers the covariation between the probability density functions of different variables, in our case, daily precipitation, daily average temperature and maximum and minimum air temperature. Although we also tested the original Quantile Delta Mapping (QDM) method and other multivariate QDM strategies76, MBCn yielded the best results. Finally, we disaggregated each of the daily meteorological values from the GCMs using sub-daily distributions extracted from days in the corresponding months of the reference period with the most similar precipitation and extreme temperatures. To do so, we compute the Euclidean distance between the three variables retrieved for the target day in the GCMs data and the candidates of the reference period and keep the one day that minimizes this distance. Results of the downscaling procedure for all the modelling units are presented in the Supplementary Figs. 8 and 9.
TOPKAPI-ETH
TOPKAPI-ETH is a physically oriented, spatially distributed hydrological model that simulates the mass balance, evolution, and runoff contribution of glaciers, along with snow accumulation, snow-ice transition, glacier dynamics, snow melt, ice melt and ice melt under debris77. Due to its physics-oriented configuration, TOPKAPI-ETH can be applied to other mountain catchments in the world without substantial reconfiguration (only recalibration of parameters). For example, it has been applied to several catchments in the semi-arid Andes37,45 and other mountainous regions around the world77,78,79. The model includes a parametrization of glacier dynamics, which updates glacier elevation and area as a function of surface mass balance (Δh-parameterization)48. This module is essential to accurately simulate glacio-hydrological responses in decadal-scale simulations.
Following the strategy applied by Ayala et al.37 in the Maipo River basin (central Chile), TOPKAPI-ETH is applied for each glacier individually. The domain of each model is defined as the glacier area, and we adopt a 100 m horizontal resolution and a time step of 3 h for model simulations, in line with the available glacier and climate data (see previous sections). While precipitation and cloud cover transmissivity are assumed to be spatially uniform over each glacier, air temperature is distributed over the 100 m grid from the centroid of each glacier using the lapse rates derived in the previous section. The models are run from 25 May 1999, just before a precipitation event that affected most glaciers in the study region. We selected this starting date as it allows the model to have a spin-up period without excessively altering the initial ice thicknesses, which were extracted from Farinotti et al.68 and correspond to the beginning of year 2000. We use the same set of model parameters as in Ayala et al.37, except seven parameters that are calibrated independently for each modelling unit over the period 2000-2015, using 2015-2019 as an evaluation period. The calibrated parameters adjust precipitation and air temperature from the scale of CR2Met v2.0 to the glacier local scale (2 parameters), the albedo decay rate (1 parameter), melt factors for snow and debris-free ice (2 parameters) and melt factors for debris-covered ice (2 parameters). We apply an optimization algorithm to simultaneously minimize the differences between (a) observed and simulated glacier mass balance and (b) monthly time series of glacier-wide surface albedo from MODIS products. We seek to maximize a meta-objective function (F) that combines observed glacier-wide monthly average albedo and geodetic mass balance as target objective criteria:
_______________________________________________________________________
Read Also : Private sector can end global poverty – just by investing in small farmers
________________________________________________________________________
The terms and correspond to the mass balance between 2000 and 2015 calculated from the TOPKAPI-ETH simulations and the geodetic mass balance from Hugonnet et al.44, respectively.
To maximize F, we use the Shuffled Complex Evolution (SCE-UA80) global optimization algorithm. The parameter sets that produce the best results are used as a basis for producing new parameter sets, and those yielding poor model performances are gradually discarded. We limit the precipitation factors within the range 0.5 and 2.5, and the temperature offsets within −3 and 3 °C. These ranges are similar to those used in other glacier modelling studies62,81,82. Additionally, we impose the restriction that the melt factors for debris-covered ice (SRFd and TFd) must be lower than those for snow and debris-free ice (SRF and TF). For the final analysis, we discarded the results of four glaciers, for which the MODIS albedo was not available (considering the scarcity of neighbouring pixels with information), and the bias of the (calibrated) simulated geodetic mass balance was off by more than 1 m w.e. a−1. A summary of results from the calibration and validation procedures is shown in the Supplementary Figs. 2–7. The parameter values obtained in the optimisation procedure are well distributed over the range chosen for each parameter. In line with previous findings on the uncertainty and sensitivity analysis of TOPKAPI-ETH applied to Andean basins, during the calibration process, we verified that the objective function is most sensitive to variations of the precipitation factor and, in the case of debris-covered glaciers, to the melt factors for ice melt under debris. For a more detailed view on the uncertainty and sensitivity of TOPKAPI-ETH parameters, we refer the reader to these previous studies36,77,83. In the Supplementary Note 2 we include a more detailed list of the limitations in our study associated with parametric uncertainty and other sources.
Future megadroughts
As we ignore the specific hydrologic characteristics under which future droughts will develop, we work directly with meteorological droughts. We define end-of-century megadroughts as the driest 10-year periods in the period 2075-2100. To this end, we calculate a 10-year moving average of the statistically downscaled precipitation (average across glaciers) for each GCM and scenario and identify the lowest value and period of occurrence. Our choice of period length is made to approximate the duration of the Chilean megadrought.
Data availability
The results of TOPKAPI-ETH simulations and processed files for this article are available at https://doi.org/10.5281/zenodo.17105125. The annual time series of the main glaciological variables are also available in the same link.
NOTE – This article was originally published in Nature and can be viewed here


