
The Earth has been warming due to greenhouse gas emissions including carbon dioxide, which is making it difficult for humans to survive in some regions of the planet.
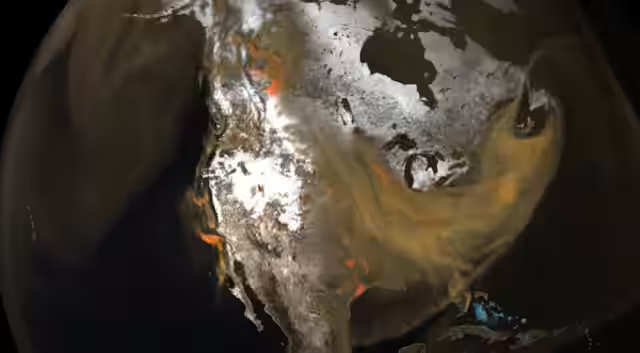
The Earth also marked its hottest day consecutively for two days in July. The video released by NASA’s Scientific Visualization Studio shows how wind and air currents are pushing emissions of carbon dioxide around the atmosphere of Earth from January to March 2020.
Greenhouse emissions are being mapped by NASA and what is seen in the video is the ghoulish churning of carbon dioxide in the sky.
________________________________________________________________________
Read Also: Climate Change and how can YOU fix it
________________________________________________________________________
The high-resolution video zooms in and looks into the individual sources of carbon dioxide, which include power plants and forest fires.
Climate scientist at NASA’s Goddard Space Flight Center in Greenbelt, Maryland Lesley Ott said, “As policymakers and as scientists, we’re trying to account for where carbon comes from and how that impacts the planet. You see here how everything is interconnected by these different weather patterns.”
So who’s the culprit of carbon dioxide emissions?
In the video, it is seen that it doesn’t matter where the carbon dioxide emissions are coming from, however, some interesting global differences were seen.
Most of the carbon is seen getting emitted from the power plants, transportation and industry located in South Asia, China and the United States.
However, in Africa and South America, most of the emissions come from burning, which includes land clearing, agricultural burning and forest fires.
________________________________________________________________________
Read Also: What Should the SEC Require in Climate Change Disclosures?
________________________________________________________________________
Watch: Indian astronauts to train at NASA from August
The image was seen pulsing due to many reasons. During the day, the forest fires flare and are seen slowing down at night.
During the day, trees and plants were seen carrying out photosynthesis which released oxygen and absorbed carbon dioxide. The oceans and land masses were seen working as carbon sinks.
The visualisations were created using GEOS (Goddard Earth Observing System), which is an integrated system to model the atmosphere, ocean, and land systems of the Earth.
NOTE – This article was originally published in wionews and can be viewed here


