Air temperatures grab the headlines, but most of the planet’s extra heat ends up somewhere else – in the ocean. There, it can linger for decades, quietly shaping sea levels, weather extremes, and marine ecosystems.
A new international analysis shows just how much energy the ocean is absorbing.
In 2025, the world’s oceans stored more heat than in any year since modern measurements began, continuing a long-term rise that reflects how much the Earth system is still warming.
Using multiple independent datasets and contributions from more than 50 scientists, the assessment estimates the ocean gained about 23 zettajoules of heat in 2025 – an amount of energy comparable to decades of global human energy use.
That hidden heat helps explain why seas keep rising, storms grow more intense, and climate impacts are becoming harder to ignore.
A clearer signal of warming
The ocean absorbs over 90 percent of the excess heat trapped by greenhouse gases. That makes ocean heat content one of the most reliable ways to track long-term warming. It’s essentially the planet’s heat ledger.
Air temperature can bounce around from year to year. El Niño can push it up. La Niña can pull it down. But the ocean’s heat content is less twitchy. When it rises, it signals the Earth system is still gaining heat overall.
This finding wasn’t based on one group’s numbers. The researchers combined three observational products from the Chinese Academy of Sciences, the Copernicus Marine Service, and NOAA/NCEI, along with an ocean reanalysis from CIGAR-RT, to cross-check the results.
The observations all pointed the same way: 2025 hit the highest ocean heat content level on record. And it’s part of a streak – ocean has set a new record high in each of the last nine years.
________________________________________________________________________
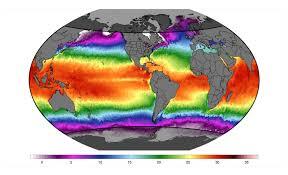
Hot spots across the ocean
Some parts of the ocean are warming faster than others, and that unevenness shapes weather patterns and marine impacts.
In 2025, about 16 percent of the global ocean area reached record-high heat content. About 33 percent ranked among the top three warmest values in their local records.
The hottest zones included the tropical and South Atlantic, the North Pacific, and the Southern Ocean.
The assessment also notes that ocean warming trends have been stronger since the 1990s than in earlier decades. In the upper 6,560 feet (2,000 meters), the heat increase has been steady for a while, with hints that the rate has ticked up slightly.
Heat moves below the surface
Sea-surface temperature in 2025 ranked as the third warmest year in the instrumental record, still about 0.9 °F (0.5 °C) above the 1981–2010 average.
It was slightly lower than in 2023 and 2024, largely because the tropical Pacific shifted from El Niño toward La Niña.
That doesn’t contradict the ocean heat record. Surface temperatures can dip a little as heat moves around vertically and geographically, while the total heat stored in the ocean keeps climbing.
Surface warmth still matters because it drives evaporation. More evaporation means more moisture in the atmosphere, which can translate into heavier rainfall and stronger tropical cyclones when storms form.
The report links warm seas to major disruptions in 2025, including widespread flooding across much of Southeast Asia, drought in the Middle East, and flooding in Mexico and the Pacific Northwest.
How ocean heat affects us
Extra ocean heat has a few big downstream effects. First, it raises sea level through thermal expansion. Warmer water takes up more space, so seas rise even without adding meltwater from ice.
Second, it can intensify extremes. A warmer ocean can feed heat and moisture into the atmosphere, strengthening heavy rain events and helping some storms pack more punch. It can also prolong heatwaves by keeping the background climate warmer.
The uncomfortable bottom line is straightforward: as long as the planet keeps accumulating heat, ocean heat content keeps rising. That means records will keep falling.
________________________________________________________________________
Warming’s toll on oceans
The journal is assembling a special collection on ocean heat content changes, including studies on regional patterns and mechanisms in places like the seas around China, the South Pacific, and the Indian Ocean.
The cover includes cartoon characters – a sad shrimp and a crab – suggested by the study’s corresponding author, Lijing Cheng.
“The idea comes from the ‘shrimp soldiers and crab generals’ guarding the underwater palace in Journey to the West,” Cheng said.
“We reimagined them not as mighty guardians, but as vulnerable creatures whose armor – their shells and scales – is under attack by ocean warming, acidification, and other ocean environmental changes.”
It’s a small detail, but it captures the point. The ocean heat record isn’t just a graph. It’s pressure on ecosystems, pressure on coastlines, and fuel for the weather that hits people where they live.
The assessment is published in the journal Advances in Atmospheric Sciences.
NOTE – This article was originally published in Earth and can be viewed here


